


(Part-3) The Tug of War: Navigating Bond Yields and Stock Market Dynamics
A Series on Bond Market :: The Bond-Equity Dance

We’ve covered the basic definitions, calculations, examples, listing process, and regulations for issuing bonds in detail in the first two parts of this series.
If you missed them, I highly recommend checking them out here —


Now, let’s dive into the relationship between bonds and equities — this is where things get really interesting.
The bond and stock markets are not merely connected; they are deeply intertwined, influencing each other in ways that often go unnoticed. The flow of money between these two markets plays a crucial role in driving stock market rallies or downturns.
Part-3
The Bond-Equity Dance: An Intricate Correlation
Now, let’s analyze the relationship between bonds and equities — the bond market isn’t just a distant cousin of the stock market; they are far more interlinked than one might assume, influencing every major move. Money flowing in and out of bonds often signals what’s ahead for equities, and understanding this correlation is essential to making sense of market cycles.How Are Bond Yields and Stock Market Returns Related?
Bond yields and stock market returns often move in opposite directions, driven by the fundamental mechanics of risk and return:
Higher Yields → Lower Stock Prices
Rising bond yields make borrowing expensive, reducing corporate profits.
Investors shift capital from stocks to bonds as they now offer better returns.
Reduced liquidity leads to stock price declines.
Lower Yields → Higher Stock Prices
Falling bond yields make borrowing cheaper, boosting business growth (and profits).
Investors seek higher returns in riskier assets like equities due to weaker bond returns. This drives up stock demand.
More liquidity and the demand fuel a stock market rally.
What Drives Bond Yields?
Inflation:
Higher inflation erodes purchasing power, pushing yields higher as compensation.
Interest Rates (Central Banks):
When central banks (Fed, RBI, ECB, etc. ) raise interest rates, it pushes bond yields higher.
Economic Growth:
A booming economy fuels demand for credit, increasing yields.
Government Debt:
Higher debt levels raise default risks, requiring higher yields.
Global Uncertainty:
In times of crisis, investors flee to bonds, lowering yields.
Bond Yields and Economic Growth
High Bond Yields → Expensive Loans → Less Investment → Slower Growth
Low Bond Yields → Cheaper Loans → More Investment → Higher Growth
Example:
In 2022, US 10-year yields shot up from ~1.5% to 4%, leading to a ~30% crash in tech-heavy NASDAQ.
In India, 10-year G-Sec yields rose above 7.5% in 2018, leading to Nifty 50 underperforming due to expensive borrowing.
Key Observation:
When bond yields spiked in 2022, equities tanked.
When yields fell in 2023, stocks rebounded.
But Wait… Bonds and Stocks Can Move Together Too!
While the inverse relationship dominates, there are times when stocks and bonds rise or fall together. Let’s look at some key instances:
1. 2020-2021 (Post-Pandemic Stimulus Boom) – Rising Together
Central banks slashed interest rates and pumped liquidity into markets.
Bond yields remained low (Bond prices rose), supporting stock rallies.
What happened?
S&P 500 surged ~27% in 2021, while US Treasuries remained strong.
Nifty 50 also rallied, gaining ~24% in 2021, fueled by RBI’s accommodative stance and global liquidity.
2. 2022 (Inflation Shock) – Falling Together
Inflation soared (~9% in the US), prompting aggressive Fed rate hikes.
Bond yields surged, making borrowing expensive, hurting stocks.
What happened?
US 10Y Treasury yield jumped from ~1.5% to 4%, causing NASDAQ to drop ~30%, with tech stocks hit hardest.
India 10Y G-Sec yields crossed 7.5%, making loans costlier and dragging Nifty’s performance (~4% gain, significantly underperforming previous years).
3. 2013 (Taper Tantrum) – Falling Together
The Fed hinted at tapering bond purchases, spooking global investors.
Yields spiked, leading to capital outflows from emerging markets.
What happened?
US 10Y yield rose from ~1.6% to 3%, leading to stock market turbulence.
Emerging markets, including India, saw significant outflows.
4. Late 1990s (Dot-Com Boom) – Rising Together
Strong economic growth with controlled inflation led to stock and bond rallies.
What happened?
S&P 500 surged ~20-30% annually (1996-1999), while bond prices remained stable.
Case Studies: Bond Yields vs. Stock Market Returns
1. United States (S&P 500 vs. 10-Year Treasury Yield)
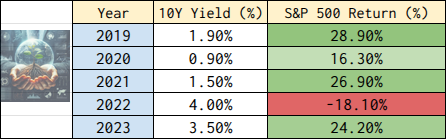
🡆 Observation:
As bond yields spiked in 2022, stocks tanked. When yields fell in 2023, markets rebounded.
2. India (Nifty 50 vs. 10-Year G-Sec Yield)

🡆 Observation:
Nifty 50 struggled when yields were above 7.5% (2018, 2022) but performed well when yields were below 7% (2019-2021, 2023).
3. Japan (Nikkei 225 vs. 10-Year JGB Yield)

🡆 Observation:
Japan had near-zero bond yields, supporting stock market growth. However, when bond yields rose in 2022, stocks fell.
Key Takeaways
✅ Falling bond yields → Stock market rally (More liquidity, cheaper loans).
✅ Rising bond yields → Stock market decline (Expensive borrowing, investor shift to bonds).
✅ Periods of economic exuberance or panic can align bond and stock movements temporarily.
✅ Central bank actions & inflation significantly impact both yields and market trends.
This interplay between bonds and equities is what makes financial markets a dynamic battlefield. The more we understand these correlations, the better we can navigate shifts in market sentiment.
Final Thoughts
This isn’t just theoretical finance — bond yields shape investment decisions globally. Whether you're a trader eyeing short-term moves or a long-term investor, keeping an eye on yield trends can give you a strong edge.